

PROJECT
PostgreSQL Engineering
Project Overview
I enrolled on a computer science course at the beginning of 2025. In 2023 I completed a data analysis course which I completed some database engineering modules for. When I got to the databases section of the computer science course, I had already completed 99% of it, so I passed the exam and saw an unfinished project waiting for me: design a database.
There were a few requirements:
- Choose a topic
- Create a data model
- Create the database
- Create users for access
- Write up the project
My chosen project is: create an ecommerce database schema and flood it with multiple tests under different configurations to monitor performance. Additionally, I’ll be using PostgreSQL as I’m least familiar with it.
Architecture
To make this a bit more fun, instead of simply installing PostgreSQL and getting to work, I created a Rocky 10 minimal virtual machine and installed PostgreSQL as a docker container. This way I could add that to the project for some extra fun, but I can turn the VM on and off when I want to test or not. The VM has very humble specs: 2 cores and 8GB of RAM.
My PGadmin install was too old to make backups and restores in this newer PostgreSQL install so I had to update my software. After that, I created the template schema, made a backup and would use that for all testing by restoring it to a new database based on the test I wanted to run, making the testing flexible and repeatable.
Model & Schema
For this I wanted to create a fairly intuitive system of tables that would work for an end-to-end experience of signing up to a website, through to getting a delivery. I didn’t create a user authentication table, as in this pretend business, it’s handled elsewhere.
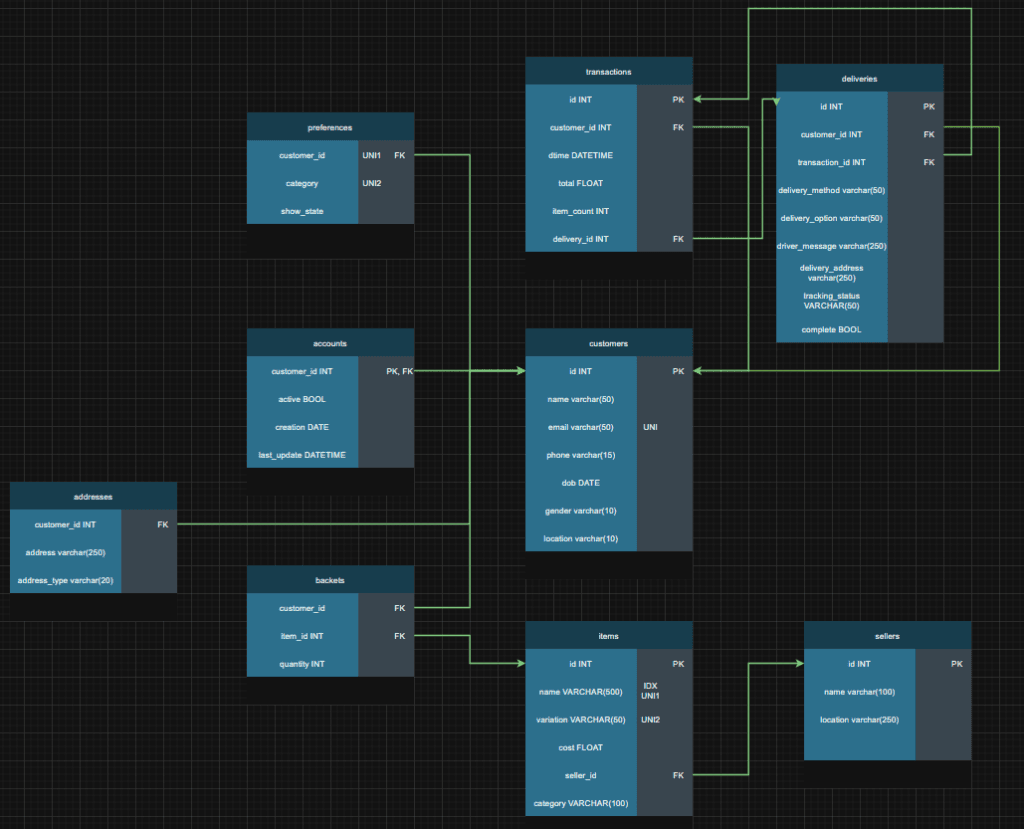
Tables
- Customers – customer name, email, phone, date of birth, gender and country location (could be normalised further)
- Accounts – Whether the account is active, when it was created, and when it was last updated
- Preferences – Per shopping category, whether they want to see recommendations or not
- Addresses – Customer addresses and type
- Baskets – A junction table for each item and quantity in each user’s basket
- Items – All items available on the site
- Sellers – All sellers and their location
- Transactions – Like an invoice of all unique checkouts linked to a delivery key
- Deliveries – All deliveries, the stage, the customer who ordered it, delivery options and if it’s complete
Test overview
Test 1 – default configuration
The following tests are on the default schema with no optimisations to get a baseline for performance (or lack there of).
Test 2 – email index
Test 2 will check if adding an index on the email column (a column used for unique user checks) would speed up the testing.
Test 3 – benchmarking and extra tests
There is no specific requirement for test 3, only to see how the database behaves and brainstorm optimisations from there.
The schema design is intentionally bare bones. With a serial primary key on the customers table, and a unique constraint on the email field so each email is only used once, and the three supporting tables (accounts, addresses, preferences) using just primary and foreign key constraints except for preferences which has a unique constraint on both customer id and category, to make sure no customer can have conflicting preferences.
Tests per run:
Test a: 1 million customer entrees as fast as possible
Test b: Test A but with the three extra tables being created (addresses, accounts, preferences)
Test c: Test B but with simulated account deactivation, reactivation, and random preference updates at a frequency of 1%, 0.5%, and 2% respectively.
Run 1 (default configuration, tests A,B,C)
Test 1A
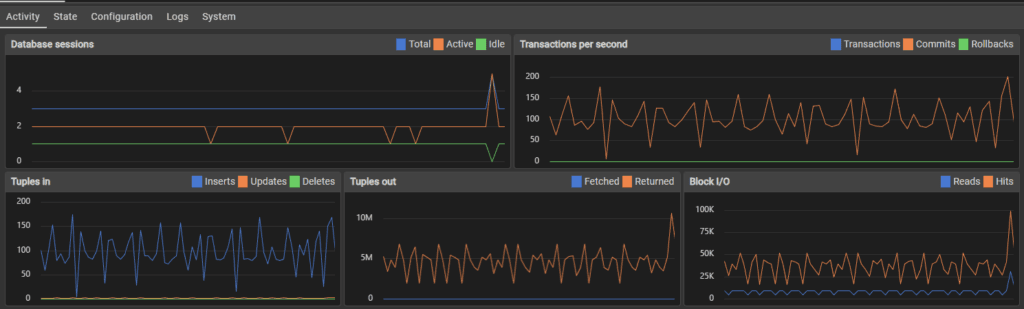
PostgreSQL kept crashing around 24k inserts. I turned on the SQL’s logging feature inside the container and reloaded PostgreSQL to see transactions per second. 600+ Transactions per second initially seen. Est 27-28 minutes for 1 million users to sign up.
Crashed after 95677 inserts. Logs reveal:
2025-11-23 18:42:11.838 UTC [44] FATAL: connection to client lost. After testing, it became apparent that NordVPN reconnecting caused my connection to drop and stopped the test. VPN was disabled for all subsequent testing.
Attempt 2 with try except in the Python code for catching duration of runs even if it crashes.
Performance started stable with more drops as the time went on.
Users added: 265003
Duplicates avoided: 21
Start: 2025-11-23 18:49:08
End: 2025-11-23 19:49:07
Second to complete: 3598
Error: server closed the connection unexpectedly
This probably means the server terminated abnormally
before or while processing the request.
PostgreSQL server crashed after 265,000 inserts. Final speed: 73.65 transactions per second (tps).
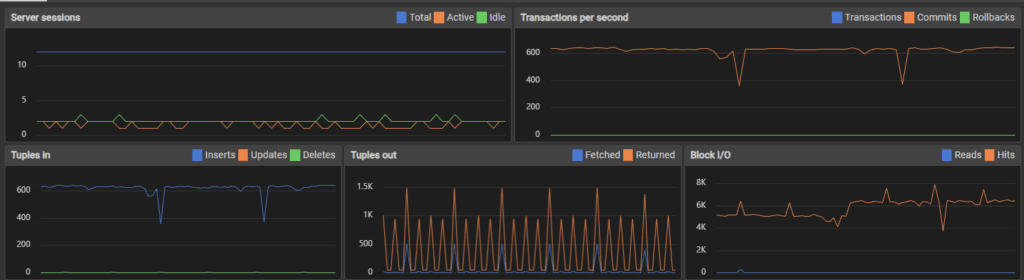
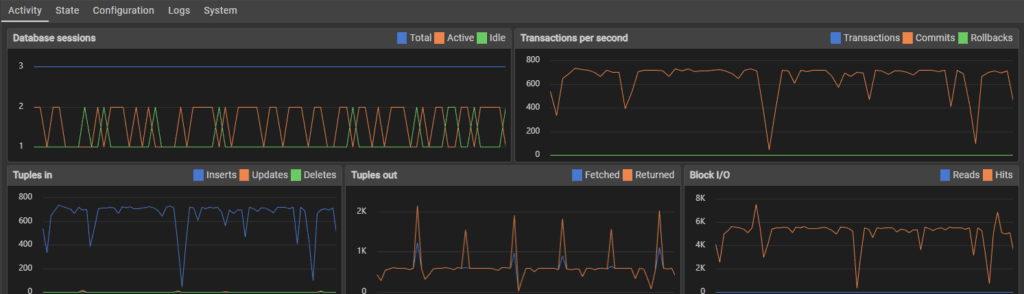
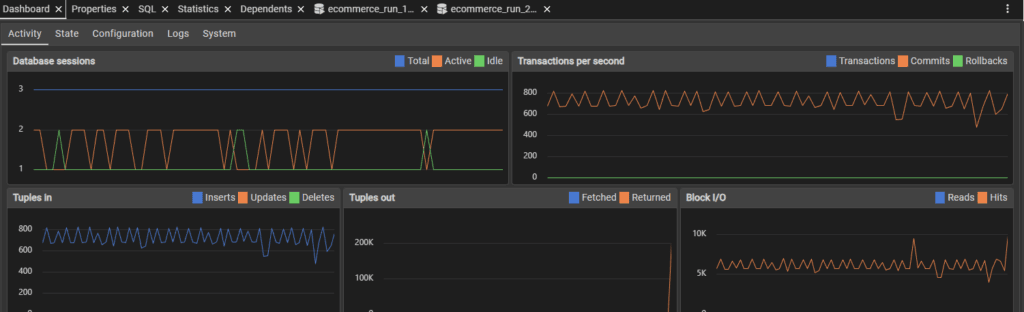
Test 1B
The second test is the first test, with the additional creating entrees in the addresses, preferences and accounts tables for each user.
Performance was initially similar to the first flood test, sitting around 600 transactions per second.
Top image is 10,000 inserts, bottom is 34,000 inserts. I think my use of the host machine for normal tasks affected performance, which might be the spikes and dips in transactions.
Error: server closed the connection unexpectedly
This probably means the server terminated abnormally
before or while processing the request.
Users added: 93482
Duplicates avoided: 3
Start: 2025-11-23 21:24:46
End: 2025-11-23 22:36:59
Second to complete: 4332
The server crashed after 93,000 inserts, which given it was creating 4 table rows each time, is more like 372,000 inserts. Performance score was 21.58 tps * 4 (86.32 tps).
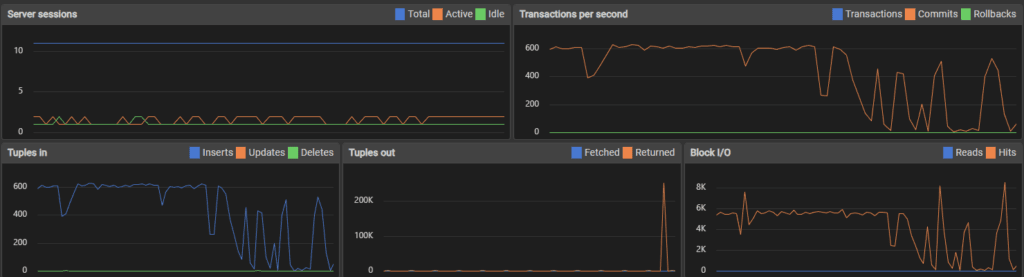
Test 1C
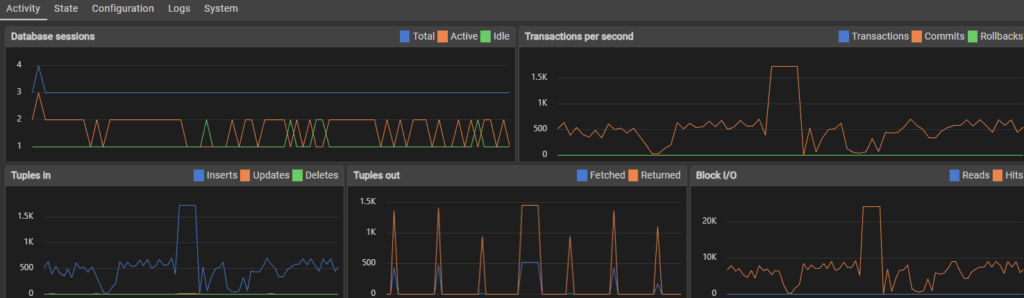
This test is test B but with the use account deactivation, reactivation and preferences updates to simulate user activity. Initially the transactions per second were around 600 as usual.
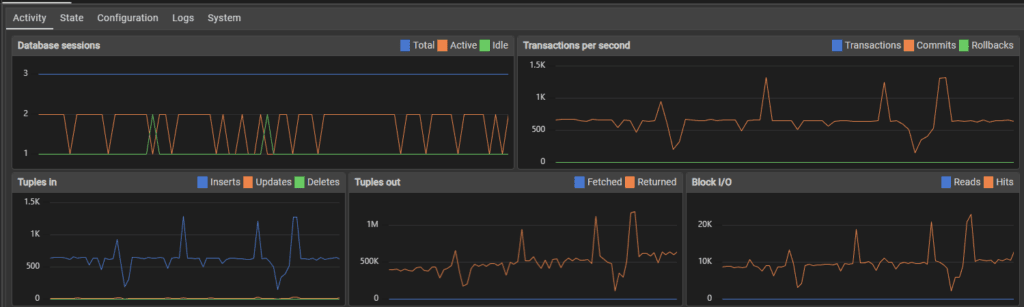
70,000 inserts later the performance fluctuated much more, with peaks and valleys rather than a steady stream of transactions.
After 100,000 inserts, the fluctuation was reduced but so was performance, slowing to around 400 transactions per second.
When approaching 1,000,000 users, the transaction rate slowed to around 100-150 per second.
Users added: 1000000
Duplicates avoided: 118
Start: 2025-11-24 21:17:50
End: 2025-11-26 22:36:09
Second to complete: 4699 + 172,800 seconds -> 177,499
Users deactivated 18519
Transactions per second: 5.6 * 4 (22.4 tps) + user activity transactions
This was the first test that didn’t crash the server, I assume because the increased time to computer checks and simulate activity spread the load rather than flooding with constant inserts. Perhaps the server slowed enough that it became unlikely to crash even if this wasn’t the case, but I did notice over the testing that when transactions hit more then one table, and when load as more distributed to things other than simply bulk inserting, the server handled it much better and sometimes faster.
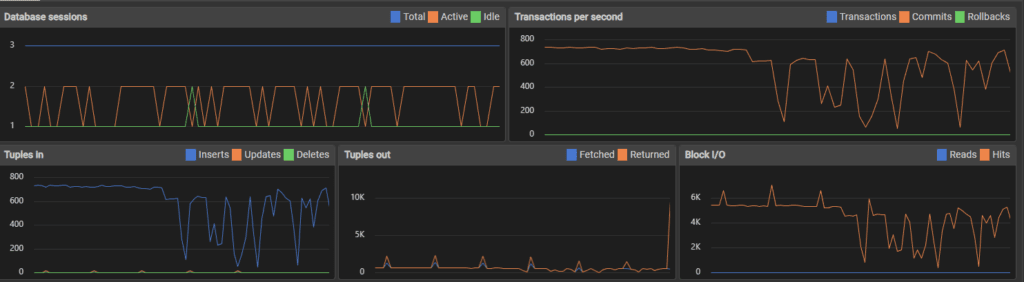
Test 2 (email index on main table)
Test 2A
The testing started off fairly similar to the initial testing. I was also using my computer while doing some of the testing which I think explains the loaded transaction rate seen below.
267,000 inserts in and performance is not only holding steady, but the server isn’t crashing.
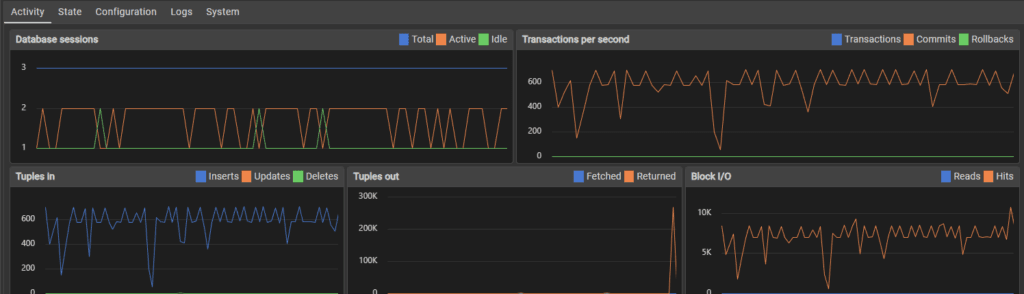
580,000 inserts later and the server held steady until the full million users were added.
Users added: 1000000
Duplicates avoided: 124
Start: 2025-11-27 17:42:00
End: 2025-11-27 20:07:10
Second to complete: 8710
Transactions per second: 114.81
This marks an enormous performance increase and stabilised the small SQL server so much that it didn’t crash, all from adding a single index.
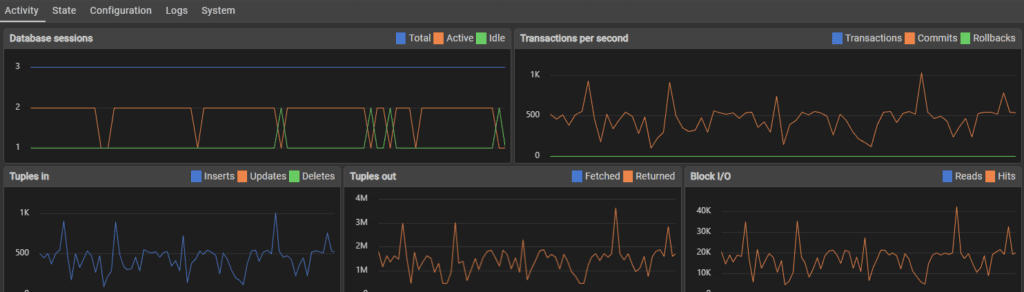
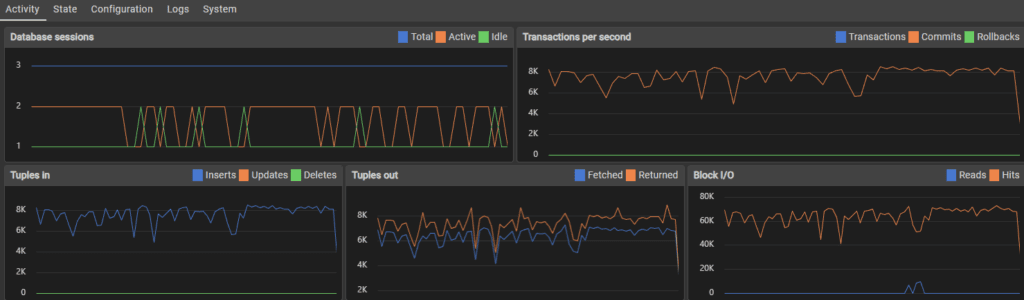
Test 2B
Testing started off just like all other tests did – sitting steady around 600 transactions per second.
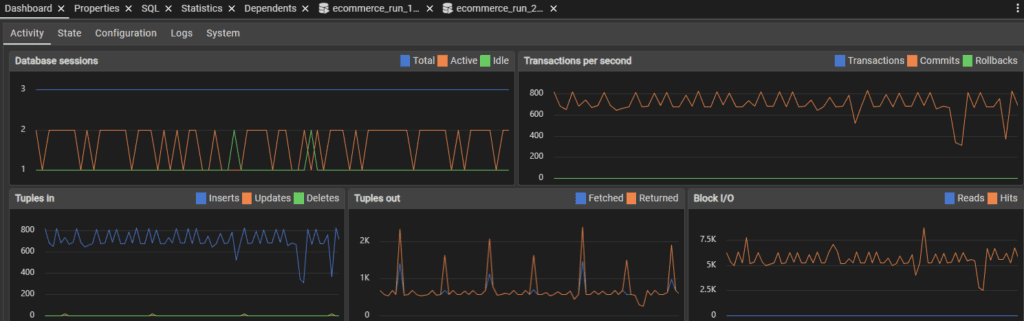
240,000 inserts in and the SQL performance held steady.
790,000 inserts later and somehow, performance seemed to skyrocket. I don’t know what caused this, but having 6,000 transactions per second is insane.
Users added: 1000000
Duplicates avoided: 113
Start: 2025-11-27 20:14:38
End: 2025-11-28 08:20:18
Second to complete: 43540
Performance: 22.97 * 4 tps (91.88 tps)
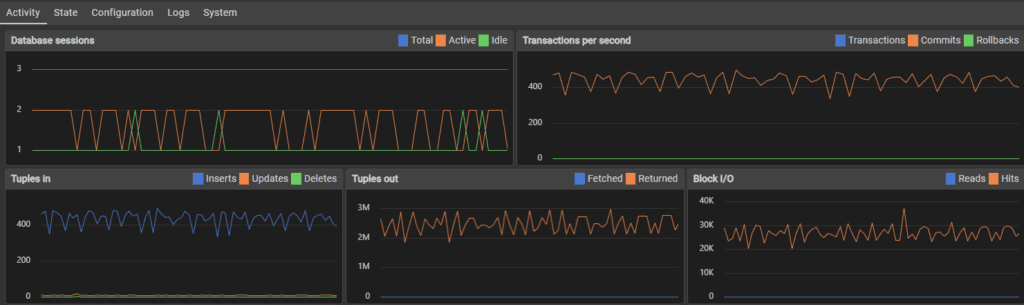
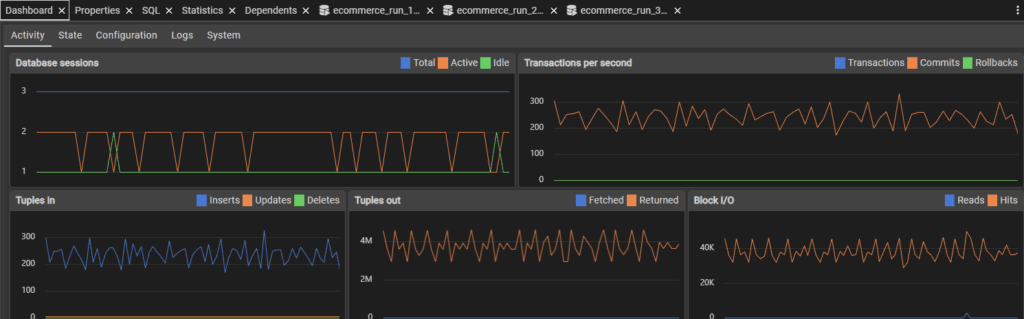
Test 2C
Performance stayed relatively similar throughout the testing period in terms of fluctuations. The speed of transactions did slow as time went on.
Users added: 1000000
Duplicates avoided: 107
Start: 2025-11-29 16:34:47
End: 2025-12-01 17:26:26
Second to complete: 3098 + 172800 = 175898
5.69 TPS (barely faster)
Test 3 (Exploring optimisations)
Before I explore further optimisations, I want to see whether in each of the A,B,C tests, that the speed of transactions slows as the size of the tables increase. I developed a timer Python module which I will release as a separate project called CyberTimers. Using this, I visualised the number of users added to the main customers table over set increments.
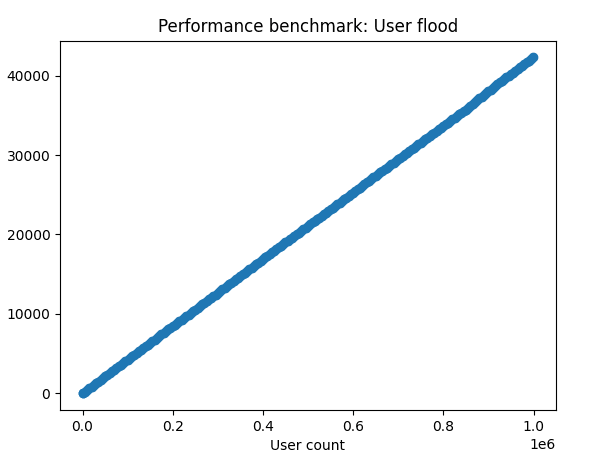
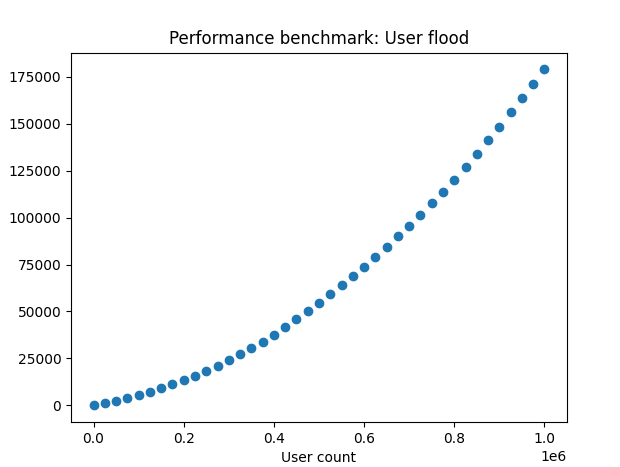
The results were quite surprising to me. I expected to see some visual slowdown, but in tests A (left) and B (right), the relationship stays linear from start to finish.
These results would mean that if there is an slowdown with the database as data is being populated throughout the one million user test, that it isn’t from any of the initial data entry or checking for existing emails in the main table.
I originally planned to explore table partitioning to solve my assumed slowdown and prepare for larger user counts, but this doesn’t seem to be the solution for this particular problem. If these is a slowdown, then it must exist in one of the C test extra queries. These being:
Block 1:
Statement 1 relies on ‘active’, a non-indexed column.
Statement 2 relies on the foreign key which is indexed.
Statement 3 relies on the foreign key again which is indexed. It also relies on the category column, but this is in conjunction with the indexed customer_id column.
Block 2:
Statement 1 relies on the ‘active’ column which is not indexed.
Statement 2 relies on the foreign key which is indexed.
Block 3:
Statement 1 relies on the ‘active’ column which is not indexed.
Statement 2 relies on the foreign key which is indexed.
Looking at these, there are two things to do:
1) Benchmark Test 1C to see if there is in fact a slowdown
2) Add an indexed to the ‘active’ column and compare results
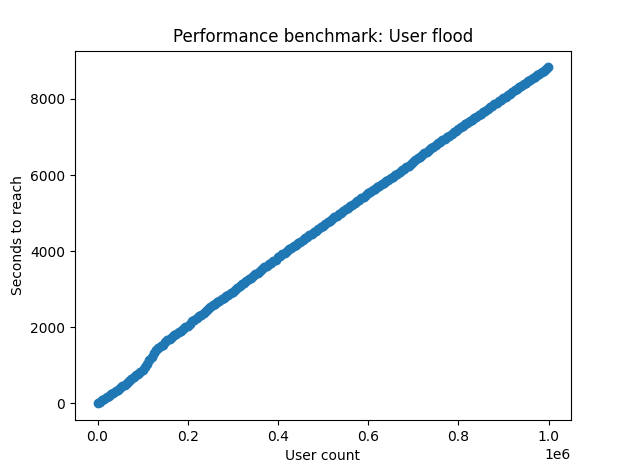
Results
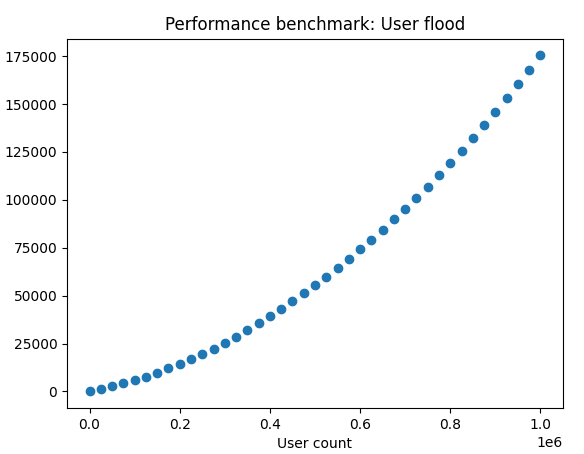
From benchmarking test 3, we can see that as the user count increases, it has an incremental affect on the speed it takes to reach each lap on the timer (left). So from this, I can see that the additional queries not only add time, but they add more time the more users are added.
After adding an index on the active column, it appears that performance is unaffected, it still slows the more the table grows (right).
Wrapping this up
Looking at the benchmark results, disappointingly, the index didn’t achieve anything. This does contrast well with the previous index that did improve efficiency. This project has been going on for a few weeks with the length of testing required, so I’m going to end this here, but here are some future thoughts:
1: As the increased time is a direct result of user simulation, it would probably be much faster if the random user activity was one script, and the user flood was another. This would be an interesting test to benchmark and measure against previous results.
2: As there should generally be more active users than inactive users, especially if the site has a retention policy on deactivated accounts, then I could change the accounts table to be exclusively for deactivated accounts. This would make the lookup range much smaller, and the script would be able to assume that if someone isn’t in that smaller deactivated_users table, then it’s active. This would likely help the script benchmark time much more than it’s ‘real-life’ application.
3: To anticipate more users bloating up the server, I might look at partitioning the users an additional tables by their geographic region, probably by continent or country. This would provide a theoretical maximum user size, especially if partitioned on the country level, but this would need significant testing.
4: I didn’t explore any postgreSQL extensions during testing, which could probably have yielded some help keeping the tables faster.
5: The server has a small footprint – 2 cores and 8GB of VRAM. The server could be scaled vertically to allocate more resources. If the database was hosted on a more typical server with something like 128 cores and many more GB’s of RAM, that the performance might not slow down so much.
6: The server could be scaled horizontally rather than being partitioned, so that servers service a region rather than containing all data.
7: Point 6 could be implemented with additional partitioning by country in each region. I thought I’d throw this out there but it does seem more complex than it needs to be, or rather, introduces complexity-related issues that a more simplistic design might not have. Both options either prevent people changing locations, or require different program complexity to adjust for.
Summary
This was a very fun project, and I learned a lot about engineering a database. My main takeaways are the importance of benchmarking and measuring performance of configuration changes to make sure schema choices have the effect that they were meant to have. Creating an index on a column in my testing both helped and didn’t. I want to keep working on this, but I’m being sucked into this a bit deeper than I would like, and want to use my time to work on the CyberTimers module I developed during testing. Perhaps there will be a V2 of this one day, but until then, I’m leaving this here.