Data Science
Powerlifting Viability
Project Overview
In 2023, I realised that I had started to make some serious lifetime peak progress in powerlifting without any indication that the progress would start slowing down. For this reason, I decided to do a data analysis of public powerlifting records from actual competitions and filter it down by comparable categories to myself (amateur without equipment) to see if I competed in an amateur competition, would I do well or would I not?
Having gone back to this now to revisit it, I’ve been hit with some interesting observations.
1) My weight has gone up, so my weight class analysis is now inaccurate by some margin
2) Not that I would have known, but I injured myself leaving 7 months of no serious bench, so my best-case scenario now in 2024 is a 155 bench
3) My squat was likely not 220 and won’t be going up that high because I’m now not confident over my depth and want to get it right
4) I don’t think I did enough in this analysis to filter out equipped results, which will obviously under-value my lifts in comparison
Platform
This analysis was completed using Google Colab. I like this platform for the way it lets you work on the same notebook from anywhere with an internet connection and doesn’t fall over by other computers not having the right modules installed.
This won’t be a play-by-play of the whole analysis (that’s what the script file is for). Here are some of the key insights and processes in the analysis.
Data Source
I decided to try a more dynamic approach to the data set collection in this analysis. I came up with the idea to take the dataset of choice, split it into 13 more manageable csv’s and save those to GitHub. I then included in the notebook code to read all 13 CSV’s from GitHub into DataFrames and combine them together to create the in-memory master data set.
The full dataset, the fragments and the notebook file are all on my GitHub:
https://github.com/thecyberdragon/Data-Analysis/tree/main/powerlifting
The Analysis Aim
The big three lifts of powerlifting are: Bench, Squat and Deadlift.
My lifts are the time of creating this in early 2024 were: 140, 220, 230 respectively.
The 2024 aims were: 160, 240, 250 respectively.
My lifetime goals are 180, 260, 275 respectively. On writing this, I saw a mistake that the variable was set to 270 not 275 (just a note).

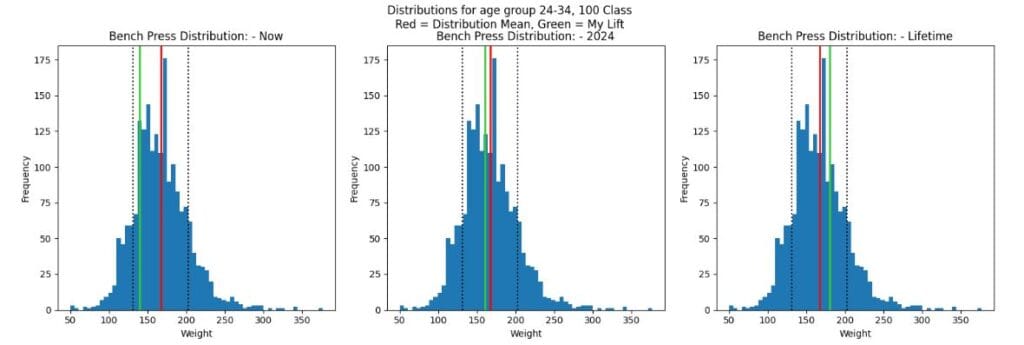
Turning data into visuals is what I love most about data analysis, so here are some charts! In all charts, the green line is my lift (early 2024, end of 2024, lifetime goal), and the red per chart shows the mean of the distribution of all non-champion and non-national athletes in my weight class and age group. The black dotted lines represent one standard deviation (STD) from the mean. For squats, if I get near to 250KG that will put me over the average. This remains to be seen if I can achieve this, though.

For bench, I am within 1 STD of the mean in all cases, and my 160 KG bench goal puts me ever so slightly behind the average. If I can hit my lifetime goal of 180KG and be roughly 100KG bodyweight, I’ll be better than average in competition!

Lastly for these charts, on the deadlift, I’m within 1 STD of the mean as with the previous lifts, and if I hit 250KG (which I’m confident I can do at the end of 2024) then I’ll be extremely close to the average.

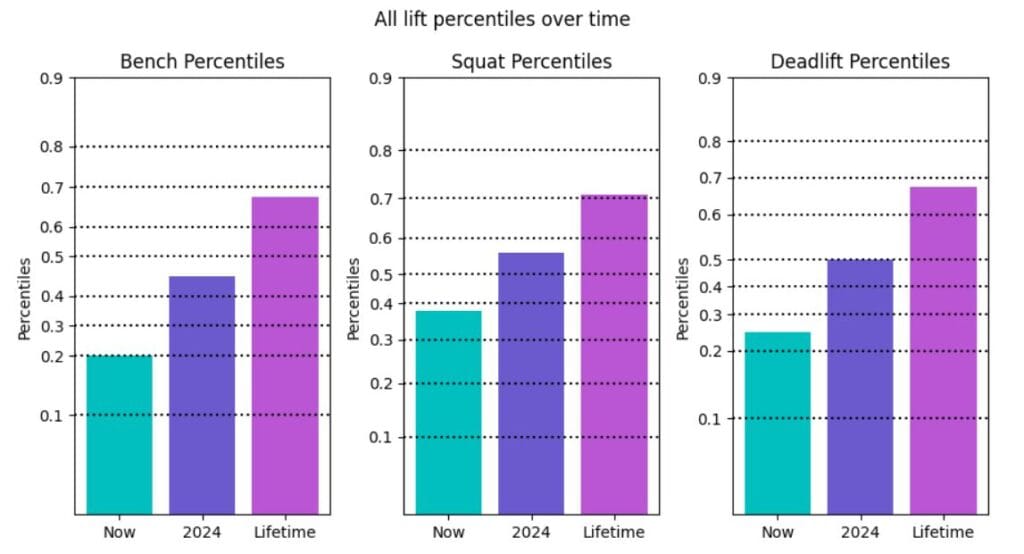
Here I broke down all three lift milestones: early 2024, end of 2024 and lifetime goal into percentiles of the distribution to see how it stacks up vertically. It shows the same thing as the above charts but being more specifically focused on placement within the distribution as opposed to showing the distribution itself, it helps make it less noisy to look at.


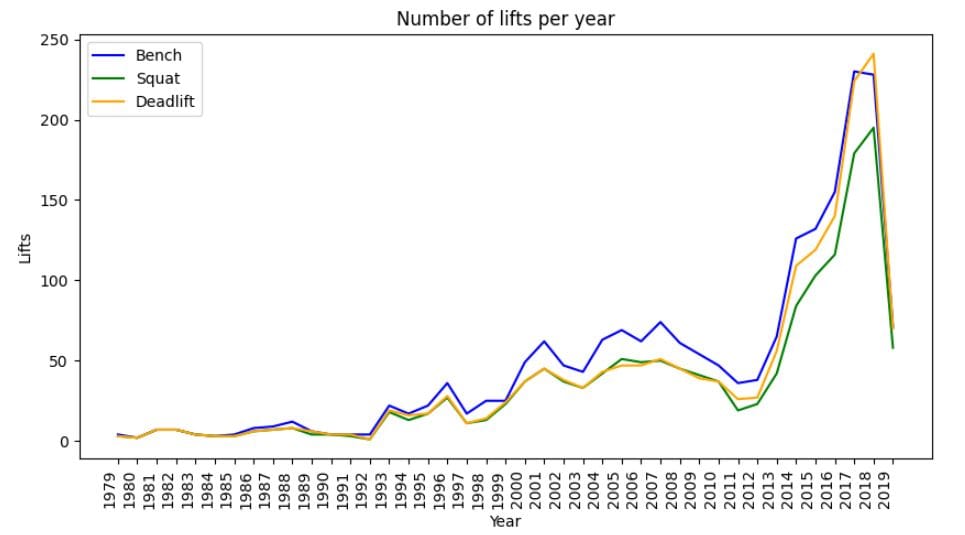
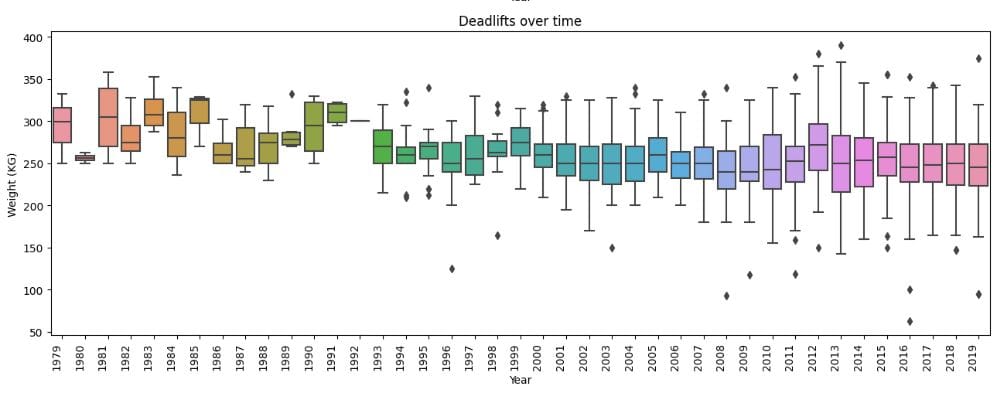
And finally, it’s always interesting (and correct) to show some context where the analysis benefits from it. It’s very important to mention that while this dataset goes back to the 80’s, powerlifting has only seen a jump in popularity from 2012 onwards. You can see this in 1) the number of lifts recorded per year (left), and 2) the interquartile ranges of the records per year (right). My assumption would be that when powerlifting was small, it was only the truly freaky monsters showing up and pulling large numbers, and when it opened up to more people, we’d see more variability and spread in the data. This is exactly what we see. More people bring more variation (and that’s a good thing!)
Summary
This was a passion project for a few weeks. I wanted to test my data science skills after finishing a career path with Codecademy in data analysis, and it’s also a subject I’m interested in so it was a no-brainer. This analysis gave me the confidence to take my powerlifting more seriously and unless I become injured again, I can see myself competing in 2025, even if I don’t hit all my end of 2024 goals. I’m competing in December 2024 at my gym for a friendly strength competition, so the groundwork has been set.
Beyond this, the improvements in data literacy I have gained since I conducted this analysis have allowed me to see how I could do this better and where the analysis is a little rough around the edges.
